Debugg AI — MCP Server
AI-powered browser testing via the Model Context Protocol. Point it at any URL (or localhost) and describe what to test — an AI agent browses your app and returns pass/fail with screenshots.
Setup
Requires Node.js 20.20.0 or later (transitive requirement from posthog-node@^5.26.0).
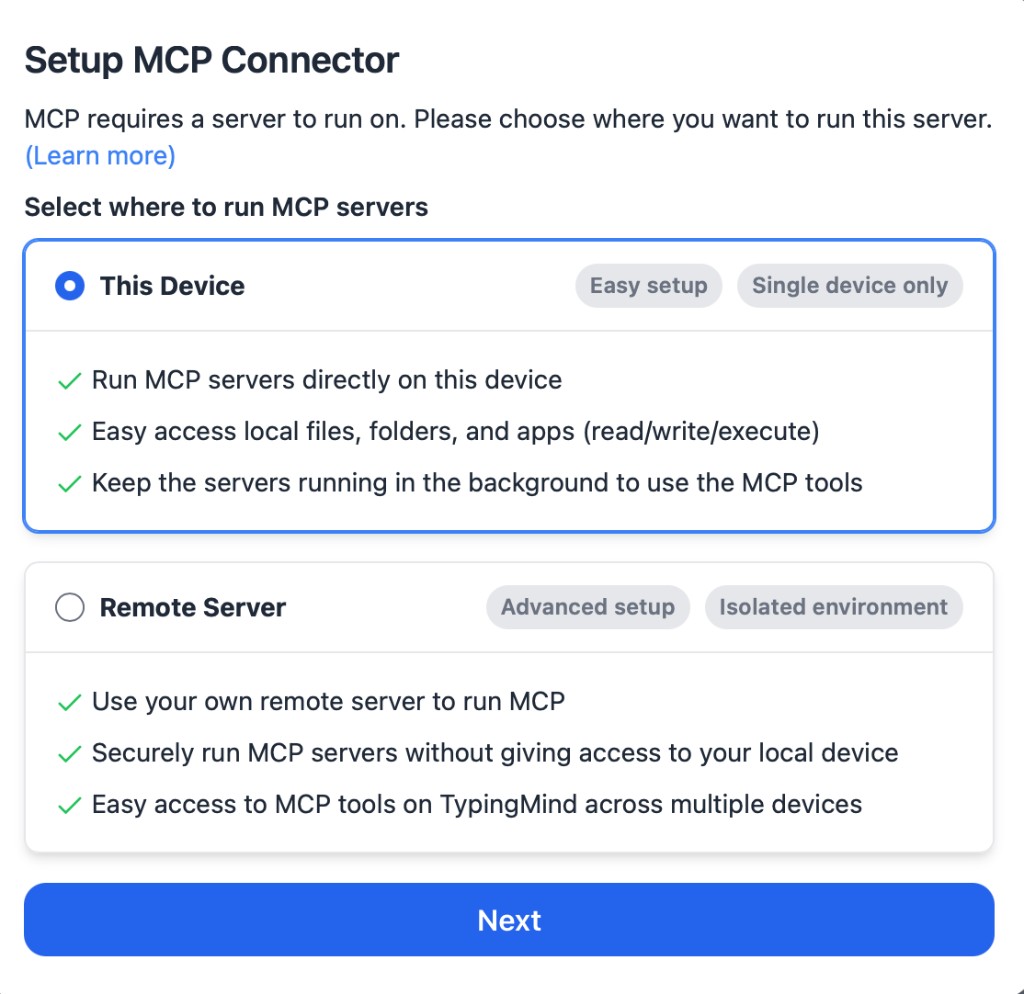
Get an API key at debugg.ai, then add to your MCP client config:
json{ "mcpServers": { "debugg-ai": { "command": "npx", "args": ["-y", "@debugg-ai/debugg-ai-mcp"], "env": { "DEBUGGAI_API_KEY": "your_api_key_here" } } } }
Or with Docker:
bashdocker run -i --rm --init -e DEBUGGAI_API_KEY=your_api_key quinnosha/debugg-ai-mcp
Tools
The server exposes 12 tools grouped into Browser (3), Search (3), Projects (3), and Environments (3). The headline tools are check_app_in_browser (full AI agent) and probe_page (lightweight no-LLM page probe); the rest manage projects, environments + their credentials, and execution history through a uniform search_* + CRUD pattern.
Browser
check_app_in_browser
Runs an AI browser agent against your app. The agent navigates, interacts, and reports back with screenshots. Localhost URLs are auto-tunneled via ngrok.
| Parameter | Type | Description |
|---|---|---|
description | string required | What to test (natural language) |
url | string required | Target URL — http://localhost:3000 is auto-tunneled |
environmentId | string | UUID of a specific environment |
credentialId | string | UUID of a specific credential |
credentialRole | string | Pick a credential by role (e.g. admin, guest) |
username | string | Username for login (ephemeral — not persisted) |
password | string | Password for login (ephemeral — not persisted) |
repoName | string | Override auto-detected git repo name (e.g. my-org/my-repo) |
One focused check per call. The agent has a ~25-step internal budget; split broader suites across multiple calls.
Every successful run returns a browserSession block alongside the screenshot — presigned S3 URLs for the captured HAR (full network trace) and console log (every JS console message). Use them to detect refetch loops, hydration errors, and other runtime issues that pass type-checks and unit tests:
json"browserSession": { "harUrl": "https://...session_18139.har?X-Amz-...", "consoleLogUrl": "https://...session_18139_console.json?X-Amz-...", "recordingUrl": "https://...session_18139_recording.webm?X-Amz-...", "harStatus": "downloaded", "consoleLogStatus": "downloaded", "harRedactionStatus": "redacted", "consoleLogRedactionStatus": "redacted" }
URLs are short-lived presigned S3 — refetch the parent execution via search_executions to renew. harStatus / consoleLogStatus disambiguate 'downloaded' (URL fetchable), 'not_available' (page emitted nothing), 'failed' (capture broke). On a fresh run the URLs are commonly null because capture uploads async after the agent finishes — poll search_executions with the returned executionId until status reaches 'downloaded'. Authorization / Cookie / token/secret/api_key headers are scrubbed server-side before the artifacts are persisted.
trigger_crawl
Fires a server-side browser-agent crawl to populate the project's knowledge graph. Localhost URLs tunnel automatically. Returns {executionId, status, targetUrl, durationMs, outcome?, crawlSummary?, knowledgeGraph?, browserSession?} with knowledgeGraph.imported === true on successful ingestion. The browserSession block (HAR + console-log URLs, same shape as above) is also present on completed crawls.
probe_page
Lightweight no-LLM batch page probe. Pass 1-20 URLs; each navigates, waits for load, and returns rendered state — screenshot + page metadata + structured console errors + network summary. No agent loop, no LLM cost, no scenario assertions. Use it for "did I just break /settings?", multi-route smoke after a refactor, CI per-PR sweeps, and quick is-it-up checks where check_app_in_browser's 60-150s agent loop is overkill.
| Parameter | Type | Description |
|---|---|---|
targets | array required | 1-20 entries: [{url, waitForSelector?, waitForLoadState?, timeoutMs?}] |
targets[].url | string required | Public URL or localhost (auto-tunneled) |
targets[].waitForLoadState | enum | 'load' (default) / 'domcontentloaded' / 'networkidle' |
targets[].waitForSelector | string | Optional CSS selector to wait for after navigation |
targets[].timeoutMs | number | Per-URL timeout, 1000-30000 (default 10000) |
includeHtml | boolean | Return raw HTML in each result (default false) |
captureScreenshots | boolean | Return one PNG per target (default true) |
The whole batch shares a single backend execution + browser session + tunnel — 5 URLs in one call is dramatically faster than 5 parallel single-URL calls. Per-URL error field preserves batch resilience: a single failed target doesn't fail the others.
networkSummary aggregation key is origin + pathname — refetch loops (?n=0..4 repeatedly hitting the same endpoint) collapse into a single entry with the count, so /api/poll showing up with count: 47 is the actionable "infinite refetch loop" signal users originally asked for.
Performance budget: <10s for 1 URL, <25s for 20. Localhost dead-port returns LocalServerUnreachable in <2s without burning a workflow execution.
Search (dual-mode: uuid detail OR filtered list)
Each search_* tool has two modes. Pass {uuid} for a single-record detail response. Pass filter params for a paginated summary list. 404 from the backend surfaces as isError: true with {error: 'NotFound', message, uuid}.
| Tool | UUID mode | Filter mode |
|---|---|---|
search_projects | {uuid} → curated project detail | {q?, page?, pageSize?} → paginated summaries |
search_environments | {uuid, projectUuid} → env with credentials inlined | {projectUuid?, q?, page?, pageSize?} → paginated envs, each with credentials array |
search_executions | {uuid} → full detail with nodeExecutions + state | {status?, projectUuid?, page?, pageSize?} → paginated summaries |
projectUuid is optional on search_environments — if omitted, it auto-resolves from the git repo. Credentials are always returned without passwords.
Projects
| Tool | Purpose |
|---|---|
create_project | Requires name + platform. Team and repo resolve by either uuid or name: pass teamUuid OR teamName, and repoUuid OR repoName. Name resolution is case-insensitive exact match; NotFound if none, AmbiguousMatch with candidates if multiple. |
update_project | PATCH name, description. |
delete_project | Destructive — cascades environments, credentials, and execution history. |
Environments (credential sub-actions folded in)
| Tool | Purpose |
|---|---|
create_environment | Requires name + url. Optional credentials: [{label, username, password, role?}] seeds credentials in the same call. Per-cred failures surface in credentialWarnings[] without blocking env creation. |
update_environment | PATCH env fields (name, url, description) plus credential sub-actions in one call: addCredentials[], updateCredentials: [{uuid, ...patch}], removeCredentialIds: [uuid]. Execution order: remove → update → add (freed labels can be re-added in one request). |
delete_environment | Destructive — cascades credentials. |
Pagination
Every filter-mode response is paginated. Response shape:
json{ "filter": { "...echoed query params..." }, "pageInfo": { "page": 1, "pageSize": 20, "totalCount": 47, "totalPages": 3, "hasMore": true }, "<items>": [ ... ] }
Pass optional page (1-indexed, default 1) and pageSize (default 20, max 200; oversized values are clamped). No response is ever silently truncated.
Security invariants
- Passwords are write-only. They never appear in any response body from any tool.
- Tunnel URLs (
*.ngrok.debugg.ai) are stripped from all browser-agent responses, including agent-authored text. - 404s from the backend surface as
isError: truewith{error: 'NotFound', ...}, never as thrown exceptions. - Missing
DEBUGGAI_API_KEYsurfaces as a structured tool error on first invocation — the server still registers and lists tools normally.
Migration from v1.x (breaking change in v2.0.0)
v2 collapsed a 22-tool surface to 11. Old-tool → new-tool mapping:
| Removed | Replacement |
|---|---|
list_projects, get_project | search_projects (uuid mode vs filter mode) |
list_environments, get_environment | search_environments |
list_credentials, get_credential | search_environments — credentials inline on each env |
create_credential | create_environment({credentials: [...]}) seed, or update_environment({addCredentials: [...]}) |
update_credential | update_environment({updateCredentials: [{uuid, ...patch}]}) |
delete_credential | update_environment({removeCredentialIds: [uuid]}) |
list_teams, list_repos | create_project({teamName, repoName}) — name resolution with ambiguity handling |
list_executions, get_execution | search_executions |
cancel_execution | Dropped — backend spin-down is automatic |
Response-shape changes: the bare count field on list responses is gone — use pageInfo.totalCount.
Configuration
| Env var | Required | Purpose |
|---|---|---|
DEBUGGAI_API_KEY | yes | Backend API key. Aliases: DEBUGGAI_API_TOKEN, DEBUGGAI_JWT_TOKEN. |
DEBUGGAI_API_URL | no | Backend base URL. Defaults to https://api.debugg.ai. |
DEBUGGAI_TOKEN_TYPE | no | token (default) or bearer. |
LOG_LEVEL | no | error / warn / info (default) / debug. |
POSTHOG_API_KEY | no | Override the embedded telemetry project key (e.g. private fork). |
DEBUGGAI_TELEMETRY_DISABLED | no | Set to 1 / true / yes / on to disable telemetry entirely. |
bashDEBUGGAI_API_KEY=your_api_key
Telemetry
The MCP server ships with telemetry enabled by default — an embedded write-only PostHog project key (phc_*) so the team can observe cache hit rates, poll cadence, tunnel reliability, and other operational metrics across the install base. Captured events:
| Event | When |
|---|---|
tool.executed / tool.failed | Per tool call |
workflow.executed | Per browser-agent execution (carries pollCount, durationMs, finalIntervalMs) |
tunnel.provisioned / tunnel.provision_retry / tunnel.stopped | Per tunnel lifecycle event |
template.lookup / project.lookup | Cache hit/miss with durationMs on cold-call |
Privacy posture:
- The distinct ID is
SHA-256(api_key).slice(0, 16)— never the raw key, no PII. phc_*keys are write-only by PostHog convention; safe to embed in source.- Set
DEBUGGAI_TELEMETRY_DISABLED=1to opt out entirely (resolves to a no-op provider; no events leave the process).
The active mode is logged at boot:
Telemetry enabled (PostHog, DebuggAI default project). Set DEBUGGAI_TELEMETRY_DISABLED=1 to opt out. Telemetry enabled (PostHog, custom POSTHOG_API_KEY) Telemetry disabled (DEBUGGAI_TELEMETRY_DISABLED is set)
Local Development
bashnpm install npm run build npm run test:e2e # real end-to-end evals against the backend
The eval suite spawns the built MCP server as a subprocess, exercises every tool against a real backend, and writes per-flow artifacts to scripts/evals/artifacts/<timestamp>/. See scripts/evals/flows/ for the individual scenarios.
MCP registration: debugg-ai-local vs debugg-ai
This repo ships a .mcp.json that registers a project-scoped server named debugg-ai-local pointing at node dist/index.js — the freshly-built local code. It only activates when Claude Code's working directory is this repo.
Your other projects should use the user-scoped debugg-ai registration that pulls from the published npm package:
bashnpm run mcp:global # registers debugg-ai in ~/.claude.json to npx -y @debugg-ai/debugg-ai-mcp
After editing code here, run npm run mcp:local (which just rebuilds) so the next invocation of debugg-ai-local picks up your changes.
Links
Dashboard · Docs · Issues · Discord
Apache-2.0 License © 2025 DebuggAI